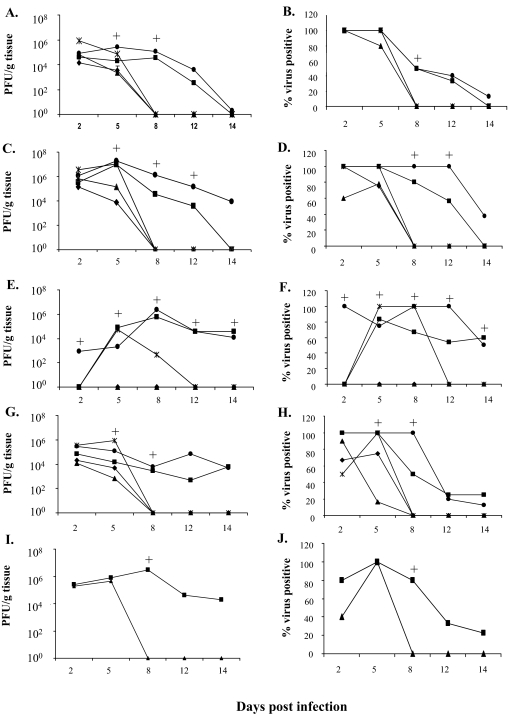
FIG. 3.
Virus titers in intestines and extraintestinal organs following RRV infection in 5-day-old wild-type mice or selected IFN receptor KO and STAT1 KO mice. On different days postinfection, groups of 4 to 10 mice were sacrificed and virus titers in indicated tissues were determined by plaque assay on MA104 cells (see Material and Methods). The graphs on the left (A, C, E, G, and I) show the geometric mean virus titers for different tissues, and the graphs on the right (B, D, F, H, and J) show the percentages of virus-positive tissues on the indicated day. Geometric mean virus titers were calculated from those samples that contained detectable virus. When a mouse in a group became virus negative at any time point, a value of 1 was assigned. On day 8 p.i. or later, the percentage of virus-positive organs in the IFN-αγR KO and STAT1 KO groups declined but the titers in virus-positive animals generally remained high. Tested tissues included intestine (A and B), liver (C and D), pancreas (E and F), MLN (G and H), and bile duct (I and J). +, P < 0.05 for IFN-αγR KO or STAT1 KO mice versus wild-type mice with the Mann-Whitney test (virus titration) or Fisher's exact test (percent virus positive). Statistical analyses were performed with all samples in the groups included for all the tests in this study. See Results for more of the statistical results. Symbols: ▪, IFN-αγ R KO; •, STAT1 KO; ✴, IFN-αR KO; ⧫, IFN-γ R KO; ▴, wild type.

