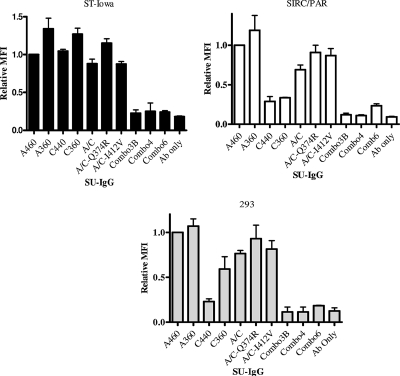
FIG. 5.
Binding data of SU-IgG of selected mutated PERV-A/C SUs compared to control PERV-A and PERV-C SU in ST-Iowa, SIRC/PAR, and 293 cells. The y axis shows the relative mean fluorescence intensity (MFI), representing results after normalization to A-360 binding as described previously (13). Results shown are from three experiments performed in duplicate. Antibody only (Ab only) refers to cells without SU-IgG treated with fluorescein isothiocyanate-conjugated anti-rabbit IgG antibody, representing the assay background. Samples were abbreviated as in the legend to Fig. 4.

