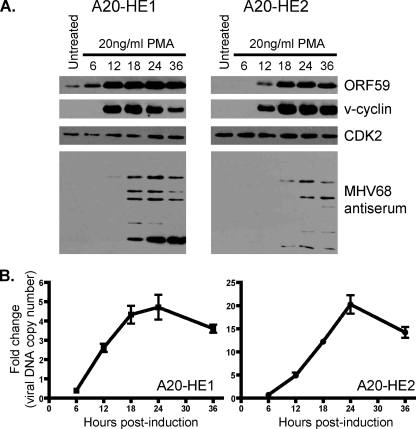
FIG. 4.
Induction time course following PMA treatment. A20-HE cells (5 × 10⁵ per ml) were treated with 20 ng/ml PMA and harvested at the indicated times posttreatment. (A) Total protein (A20-HE1, 32 μg; A20-HE2, 50 μg) was resolved by SDS-PAGE followed by immunoblot analysis for the indicated antigens. Cellular CDK2 was used as a loading control. (B) Total DNA (200 ng) was analyzed by quantitative PCR for the presence of viral genome using orf50-specific primers. Data represent the fold increase following PMA treatment relative to untreated controls as a ratio of orf50 to GAPDH. Results are means of triplicate samples. Error bars represent standard deviations.

