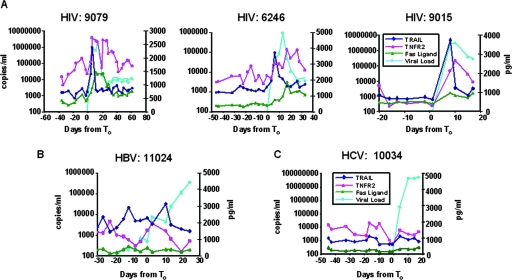
FIG. 2.
Representative plasma donor patient samples analyzed for plasma markers of cell death. (A) TRAIL, TNFR-2, and Fas ligand levels were measured for each plasma sample by ELISA for three representative HIV-1+ subjects. Data for a representative patient with acute HBV are shown in panel B; data for a representative patient with acute HCV are shown in panel C. TRAIL levels are shown in dark blue, TNFR-2 levels in red, Fas ligand levels in green, and VL levels in light blue. Whereas elevations in TRAIL, TNFR-2, and Fas ligand levels were commonly found in samples from acutely HIV-1-infected plasma donors, they were not common in samples from HBV- and HCV-infected subjects (see Table S1 in the supplemental material).

