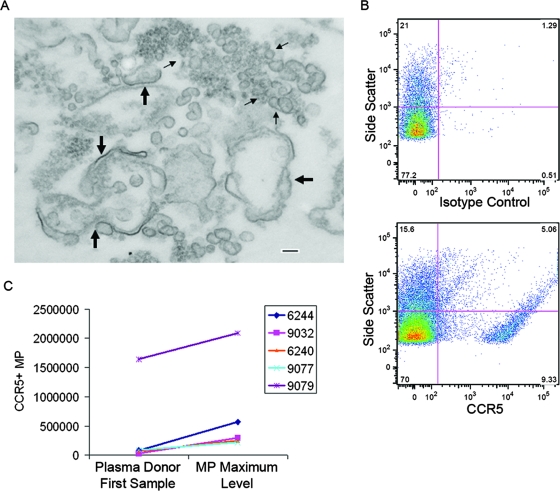
FIG. 7.
Morphology and CCR5 expression of plasma MPs in cases of acute HIV-1 infection. Panel A shows an electron micrograph of plasma MPs purified from a subject (6244) with acute HIV-1 infection at the time of peak MP and VL levels (see Fig. 4A). The micrograph shows plasma MPs that were pelleted by ultracentrifugation and purified over a sucrose pad. Large arrows indicate double-membrane MPs 100 nm to 1 μm in size. Small arrows indicate particles 30 to 100 nm in size (exosomes). Bar, 100 nm. Panel B shows flow cytometry panels obtained by labeling plasma MPs with either an isotype control (upper panel) or an anti-CCR5 monoclonal antibody (lower panel). In this sample from the time of peak VL and MP levels, 13% of MPs were CCR5+. Panel C shows comparisons of the absolute numbers of CCR5+ MPs (percentages of CCR5+ MPs determined by phenotypic flow analyses multiplied by the relative MP count) from five different seroconversion panels for the first plasma sample and at the time of peak MP levels.

