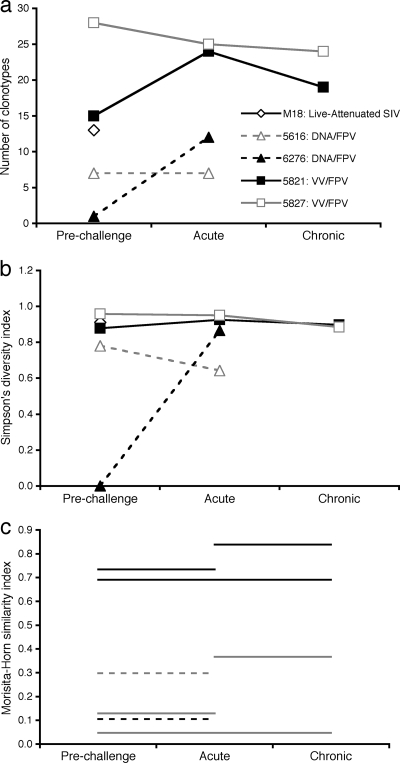
FIG. 4.
Analyses of TCR repertoire similarity and diversity. The diversity of the TCR repertoire was assessed in three different ways, (a) comparison of the number of clonotypes found in each animal at each time point; (b) calculation of the Simpson diversity index for each sample, a measurement of diversity that is sensitive to the presence of dominant clonotypes (0 = minimum diversity, 1 = maximum diversity); and (c) calculation of the Morisita-Horn similarity index, comparing the clonotypes present in paired samples. In panel c, each line represents the similarity between the samples indicated on the x axis; for example, the grey solid line at the bottom compares the prechallenge and postchallenge chronic samples from macaque 5827 (0 = minimum similarity, 1 = maximum similarity).

