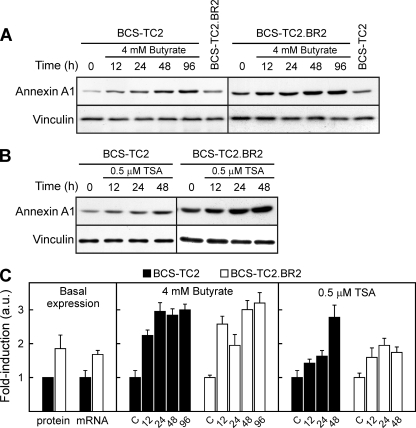
FIG. 1.
Western blot and quantitative real-time reverse transcription-PCR analyses of annexin A1 expression. (A) The effects of 4 mM butyrate treatment for different times in BCS-TC2 and BCS-TC2.BR2 cells were analyzed. The basal expression level of both cell lines is included in the same blots for comparison; controls (0) did not vary with time in culture (not shown). Vinculin expression was analyzed as a control for equal protein loading and used to normalize data. (B) Effect of 0.5 μM TSA treatment. Control cells were incubated with the same concentration of DMSO added in TSA treatment. Representative blots from four independent experiments are shown. (C) Quantitative real-time reverse transcription-PCR was carried out after treatment of cells with 4 mM butyrate and 0.5 μM TSA for different periods of time. Data are normalized to levels for GAPDH as an internal control, and a value of 1 is assigned to the corresponding untreated control in each cell line. The left panel shows a comparison of basal protein and mRNA expression levels in both cell lines, in reference to BCS-TC2 cell levels. Data represent mean values (± standard deviations [SD]) for four different experiments. a.u., arbitrary units.

