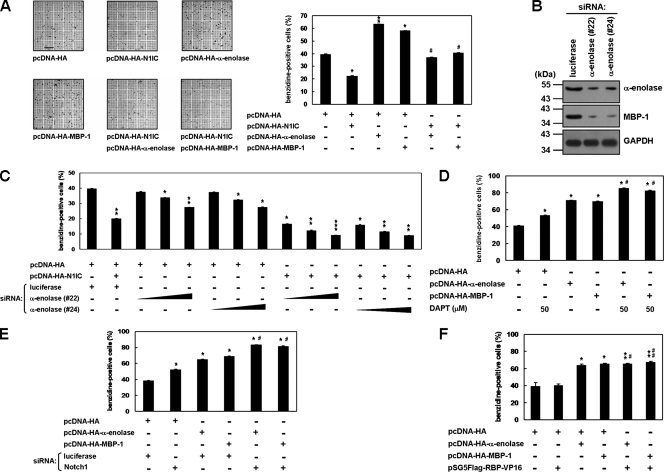
FIG. 6.
α-Enolase and MBP-1 relieve the N1IC-suppressed erythroid differentiation in K562 cells. (A) K562 cells were transfected with plasmids expressing the indicated proteins or their control vector for 2 days. The transfected cells were treated with 40 μM hemin for 2 days to induce erythroid differentiation, and then the benzidine-positive cells were counted after staining. Bar, 0.2 mm. (B) K562 cells were transfected with siRNA vectors against α-enolase and MBP-1 (no. 22 and 24) or luciferase for 2 days. Whole-cell extracts of the transfected cells were used to evaluate knockdown of endogenous α-enolase and MBP-1. Western blot analysis was performed using anti-α-enolase and anti-GAPDH antibodies. (C) K562 cells were cotransfected with the pcDNA-HA-N1IC expression plasmid and various amounts (0.25, 0.5, and 1.0 μg) of siRNA vectors against α-enolase and MBP-1 (no. 22 and 24). (D) MBP-1- or α-enolase-expressing constructs were transfected into K562 cells treated with 50 μM DAPT. (E) K562 cells were cotransfected with expression constructs of the indicated proteins and siRNA vector against Notch1 receptor or its control vector. (F) Expression constructs of the indicated proteins were cotransfected into K562 cells. Two days after transfection, the cells were treated with hemin to induce erythroid differentiation, and then the cells were stained and counted as described above. * and #, P < 0.05; ** and ##, P < 0.01; ***, P < 0.001. Error bars indicate standard deviations.

