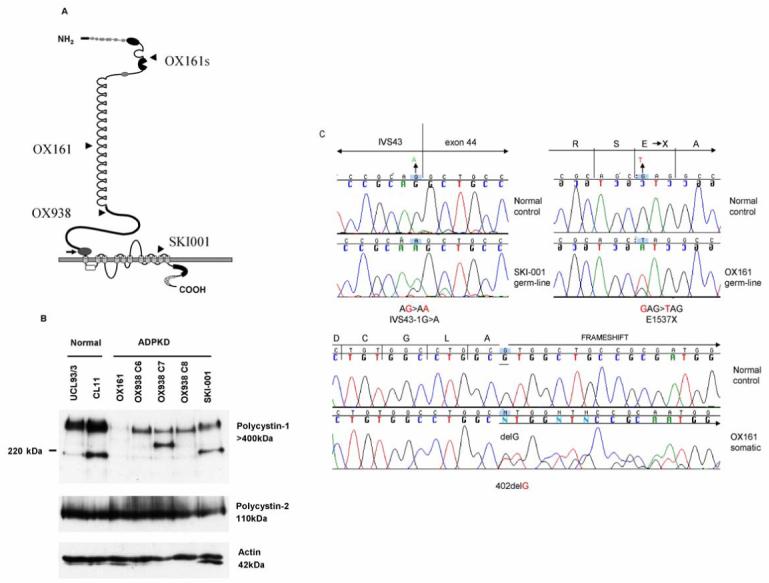
Figure 1. Mutational analysis of PKD1 and PKD2 and characterisation of PC1 and PC2 expression in ADPKD cystic epithelial cell lines.

(A) The germline (and somatic ‘s’) mutations for each cystic line are displayed on the figure of PC1. (B) PC1 and PC2 expression was examined by immunoblot using specific antibodies to both proteins: 7e12 (PC1) and p30 (PC2) respectively. ‘Full-length’ PC1 (>400kDa) expression ranged from being absent (OX161) to a clear reduction in the other four ADPKD cell lines compared to the normal cells (UCL93/3, CL11). Of interest, smaller molecular weight bands were also detected with the N-terminal PC1 mAb (7e12) in normal cells (∼200 kDa) and in two of the cystic lines (OX938 C7, SKI-001). It is possible that these may represent splice forms and mutant protein bands respectively. Significantly, PC2 expression was not affected by differences in the dosage of PC1 between lines. Actin was used to control for loading. (C) Genomic and cellular DNA was screened for PKD1 and PKD2 mutations. The chromatograms indicate the germline and somatic PKD1 mutations present in OX161, and the germline PKD1 mutation in SKI-001. The germline mutation in OX938 has been previously reported. No PKD2 mutations were detected.
