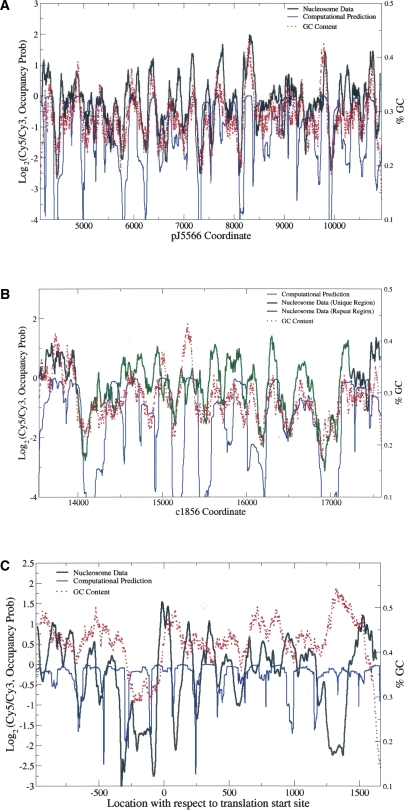
Figure 4.
Nucleosome data correlate well with sequence-based predictions in (A) cnt2 and (B) cnt1 but not in (C) ade6. (Black line) The median nucleosome data for wild type; (blue line) the log nucleosome occupancy probability, computed as in Segal et al. (2006). (B, green line) The nucleosome data in the region repeated in cnt3; (red dotted line) the running window (size 120 bp) log GC content. In cnt1 and cnt2, the correlation between the nucleosome data and GC content is high, and the computational prediction of nucleosome locations works well. In ade6, however, the correlation is only 0.1, and the computational algorithm also fails to predict nucleosome-free regions.

