Figure 3.
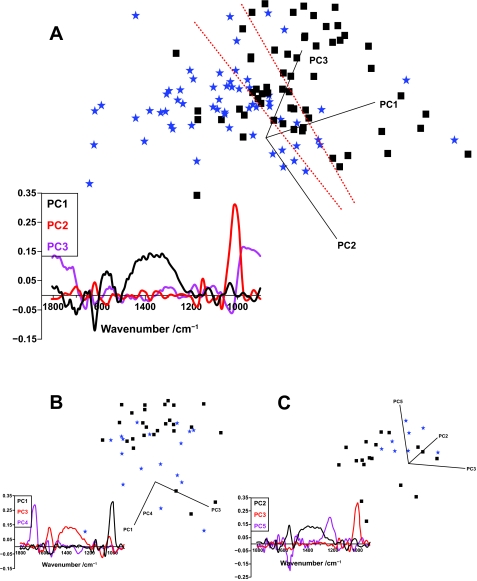
(A) PCA scores plot comparing normal (n = 60, black squares) and high-grade (n = 60, blue stars) categories of exfoliative cervical cytology derived using the biochemical-cell fingerprint region (1,800 cm−1 to 900 cm−1). The region of overlap between the scores for the two cell categories is identified between the dotted red lines. Corresponding PCA loadings plot which indicates the spectral regions responsible for segregation were derived for PC1 (black), PC2 (red) and PC3 (purple). (B) A second PCA scores plot derived from specimens that were located in the region of overlap or were outliers from the initial PCA run. Loadings plot of the second PCA for PC1 (black), PC3 (red) and PC4 (purple). (C) A final scores plot of specimens located in the overlap region or were outliers from the second PCA. Loadings plots of the final PCA were obtained for PC2 (black), PC3 (red) and PC5 (purple).

