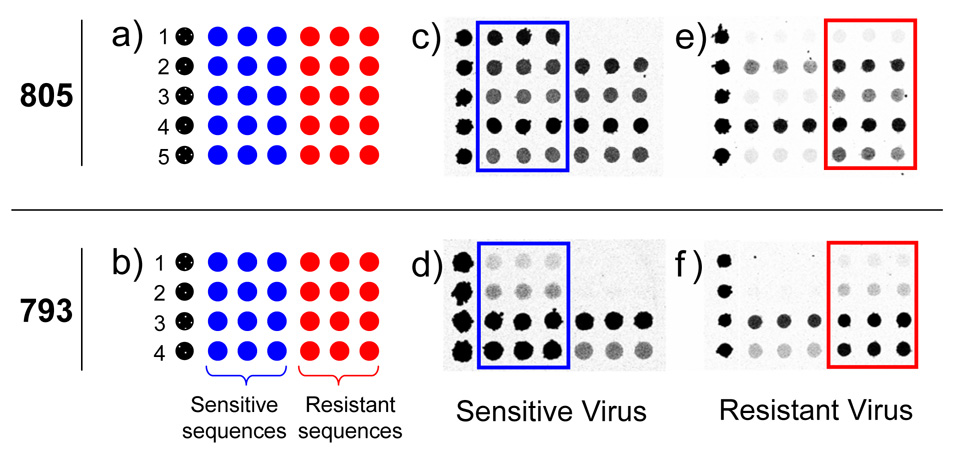
Figure 2.

Microarray layout (a and b) and hybridization images (c–f) for probes designed to query positions 805 (S31N mutation) and 793 (V27A mutation). Each numbered row represents a specific probe sequence designed for either the 805 or 793 mutation. In (c–f) darker grey represents higher fluorescence intensity. The drug sensitive specific sequences are boxed in blue and the drug resistant sequences are boxed in red for ease of viewing. Images c and d were from drug sensitive A/H3N2 viruses. Images e and f were from drug resistant A/H3N2 viruses.
