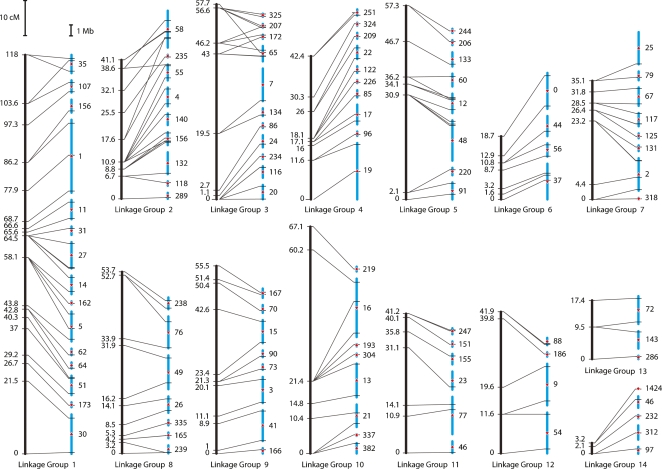
Figure 1.
Integrated genetic map and extended sequence assembly. Fourteen linkage groups in C. savignyi were identified by genetically mapping 182 markers, corresponding to 110 distinct genetic loci. Vertical black bars represent the genetic linkage map. All bars are drawn to scale; the length of the bars is proportional to the number of centimorgans (cM). Map distances at each mapped genetic locus are indicated to the left of each bar. Blue bars on the right of each pair represent reftigs. Tick marks indicate the physical location of the markers among the 104 mapped reftigs. Transverse lines link the location of each marker on the genetic and physical maps. Numbers to the right of each assembly fragment correspond to reftig identifiers in Version 2.1 of the assembly (Small et al. 2007a). When two or more markers on the same reftig allowed the orientation of the fragment to be resolved, the orientation is indicated with a red arrow pointing up or down for the positive or negative orientation, respectively. Red diamonds indicate unknown orientation. The gap size between reftigs is arbitrary since the true physical distance between mapped reftigs is unknown.

