Figure 2.
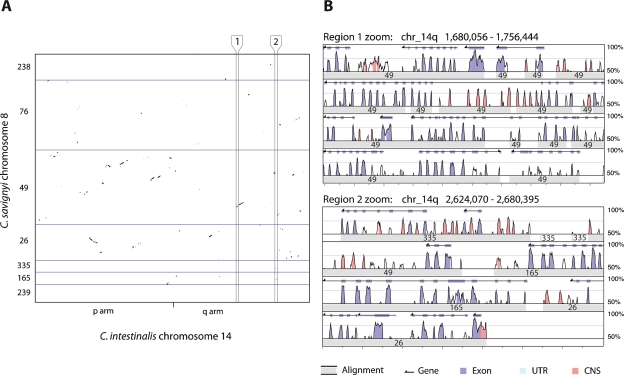
Conservation of synteny and loss of colinearity between C. savignyi and C. intestinalis. (A) Plot of alignments between C. intestinalis chromosome 14 and its C. savignyi ortholog, chromosome 8, reveals the extent of intrachromosomal rearrangement since these species diverged from their last common ancestor. Ordered C. savignyi reftig identifiers are shown along the Y-axis, with blue lines indicating boundaries between reftigs. The minor tick on the X-axis represents the boundary between the short (p) and long (q) chromosome arms of C. intestinalis. The aspect ratio of the plot is one. Alignments within the regions bounded by vertical black lines and labeled 1 and 2, are enlarged in panel B. (B) Enlargement of alignments within regions 1 and 2 reveals the quality of the alignments shown in panel A. Region 1 shows a set of colinear alignments, while region 2 shows a series of alignments that are linear in C. intestinalis, but widely separated in C. savignyi. This view of the alignments between the two species was adapted from the VISTA browser (http://genome.lbl.gov/vista). Each region is shown as a set of four rows of alignment plots. Within each set, each subsequent row is a continuation of the previous row. The X-axis of each plot indicates the position in the C. intestinalis genome; major tick marks are spaced at 4-kb intervals. Wide gray bars in each row represent the location of an aligning C. savignyi segment; the superimposed number indicates the C. savignyi reftig identifier. The height of the peaks is the percent identity between the sequences in 100-bp sliding windows. The area under the line is colored according to the key if the identity between the two species is >70%. Gene predictions for the C. intestinalis genome are shown at the top of each plot. (UTR) Untranslated region; (CNS) conserved noncoding sequence.

