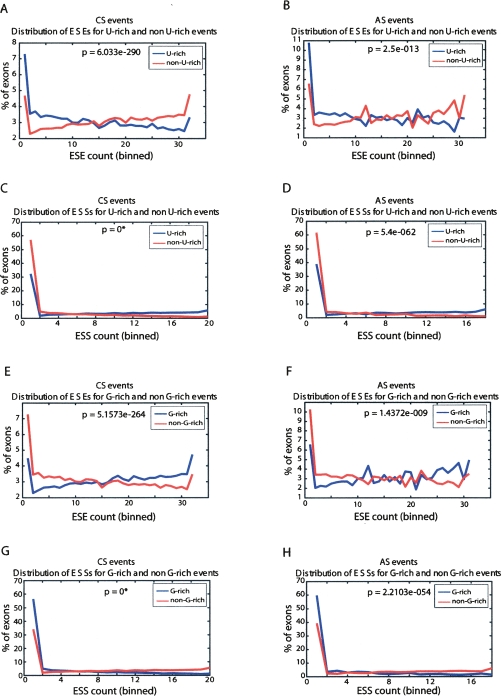
Figure 2.
Intron sequences with elevated U-content are associated with exons having reduced frequencies of ESEs and increased frequencies of ESSs. Distribution of constitutively spliced (CS) (A) and alternatively spliced (AS) (B) exons with different frequencies of ESEs that are associated with either “U-rich” downstream intronic sequences (blue lines) or non-U-rich downstream intronic sequences (red lines). Panels C and D show the corresponding plots when comparing numbers of exons with different frequencies of ESSs. A single cut-off for U-richness of 28% (>28% U-content defined as U-rich, and <28% U-content defined as non-U-rich) was used. ESE and ESS counts (X-axis) are binned into equiprobable bins over the entire corresponding event set (CS/AS), so that higher counts bins have a higher X-value. Panels E–H repeat this analysis for ESE (E,F) and ESS (G,H) elements for G-rich and non-G-rich intronic flanks. A single threshold of 22%–25% was used to separate events that contain G-rich or non-G-rich flanking intron sequences. (*)P-value too small to compute.

