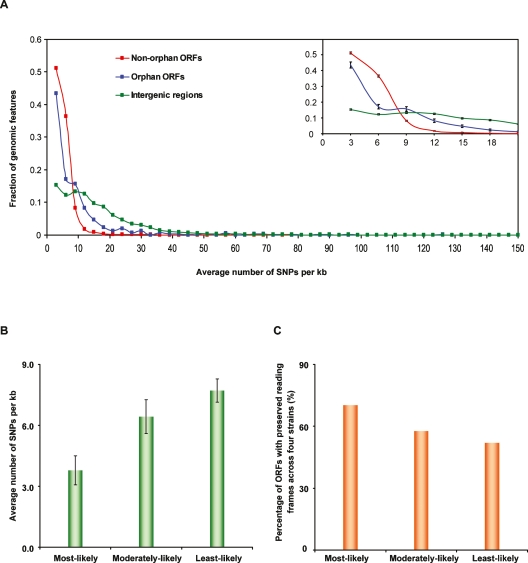
Figure 4.
Interstrain intraspecies sequence conservation for orphan ORFs. (A) Distribution of nucleotide divergence in different genomic features. We binned three types of genomic features, (1) non-orphan ORFs (red curve), (2) orphan ORFs predicted by three comparative genomic analyses (blue curve) (Brachat et al. 2003; Cliften et al. 2003; Kellis et al. 2003), and (3) intergenic regions (green curve), using a window of an average three SNPs per kb across four S. cerevisiae strains. Each dot represents the fraction of genomic features in each bin. Numbers on the X-axis represent the maximum number of SNPs per kb in each bin. For instance the first bin collects the genomic regions that have between zero and three SNPs per kb in four strains. The inset zooms in on the 0–21 SNPs per kb range with SEM displayed. (B) Comparison of nucleotide divergence among three predicted categories of orphan ORFs based on their LLRs. Error bars, SEM in each category. (C) Comparison of the percentage of ORFs among the three predicted categories of orphan ORFs that have reading frames preserved across four S. cerevisiae strains.

