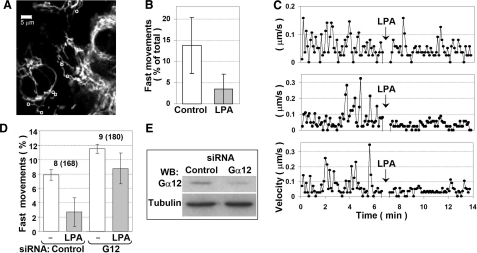
Figure 3.
LPA reduces (A–C) and Gα12 depletion (D–E) increases mitochondrial motility in HUVECs. A–C) HUVECs were starved for 24 h and incubated with MitoTracker to visualize mitochondria. A) The first frame of the recorded image sequence. Movement of 27 individual mitochondria was tracked under control conditions. Those that showed fast movement (exceeding the threshold of 0.1 μm/s) were also tracked after LPA addition (7 mitochondria marked with circles). Scale bar = 5 μm. B) Percentage of fast movements during entire recording before (control) and after (LPA) addition of LPA. Data are means ± sd; P = 0.011, paired Student’s t test. C) Representative plots of velocity vs. time for 3 individual mitochondria. Arrows indicate LPA addition. D–E) HUVECs were transfected with Gα12 siRNA duplexes or control siRNA. Mitochondrial movement was tracked 24 h after transfection for 6 min before and for additional 6 min after LPA addition. Mitochondrial movement was quantified as the percentage of mitochondria moving faster than 0.1 μm/s at any time point during recording. D) Quantification data shown are the means of two replicates (two separate slides), with error bars showing values obtained in each replicate. Data indicate total number of cells and number of individual mitochondria (in parentheses). The extent of Gα12 depletion was assessed by Western blotting using α-tubulin as a loading control (E).

