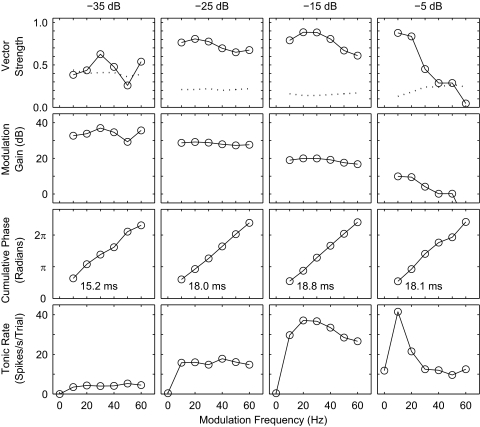
FIG. 5.
Phase-locking measures from the responses shown in Figs. 3 and 4, plotted as a function of modulation frequency. Panels are arranged by modulation depth (columns). All data are based on spikes occurring 100–600 ms after stimulus onset (i.e., onset response in the initial 100 ms is omitted). Plots in the top 3 rows (vector strength, modulation gain, and cumulative phase) are based on vector addition. Numbers in the 3rd row indicate group delay, computed from the slopes of the phase-vs.-frequency plots. The 4th row, tonic rate, plots the mean number of spikes per trial in the 100- to 600-ms postonset time period. Modulation frequencies of 0 (bottom row) indicate responses to unmodulated pulse trains.

