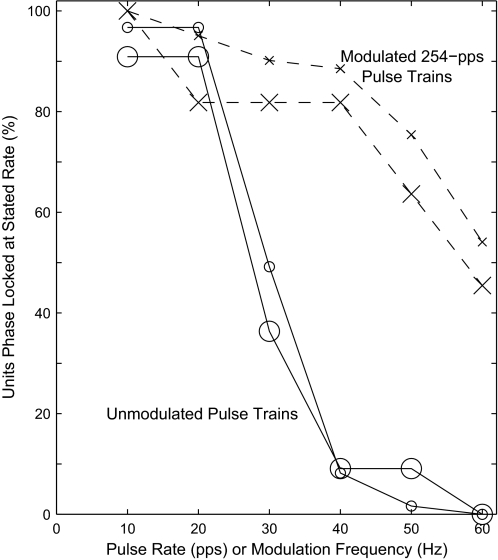
FIG. 9.
Cumulative distribution of units significantly phase locked to unmodulated pulse trains varying in pulse rate or to modulated 254-pps pulse trains varying in modulation frequency. The modulation frequency for each unit was the highest value computed across all tested modulation depths. Small symbols represent the 61 single- and multiunits (in 6 guinea pigs) that were tested both with unmodulated and modulated pulse rates in 10-pps steps of pulse rate and 10-Hz steps of modulation frequency, and large symbols represent only the 11 isolated single units.

