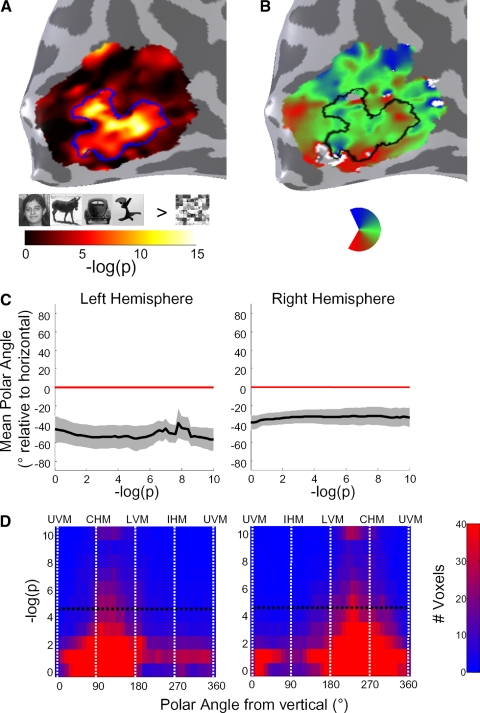
FIG. 11.
Disk analysis of the cortex around LO. A: object selectivity in a 30-mm disk centered around the center of LO on the cortical surface without any thresholding. Object-selectivity is measured by the –log(p) value of a t-test for all object categories versus scrambled. Data are shown in a representative subject (S6). B: polar angle preference in the same disk as in A, without any thresholding. The P < 10−5 boundary for LO used for the main analyses is outlined in blue in A and black in B. C: mean polar angle across LO voxels as a function of object-selectivity threshold. x axis denotes object-selectivity threshold used to select voxels within the disk; y axis denotes the mean polar angle across subjects, among voxels passing a given threshold (positive values = above horizontal, negative values = below horizontal). Error bars are SE across subjects. D: joint histograms of object selectivity and preferred polar angle for all voxels across subjects. The color intensity of each bin represents the count of voxels with preferred polar angle contained within the given x-axis range, and object-selectivity [−log(p)] within the y-axis range. Dashed line indicates the statistical threshold used to define LO for the main analyses.

