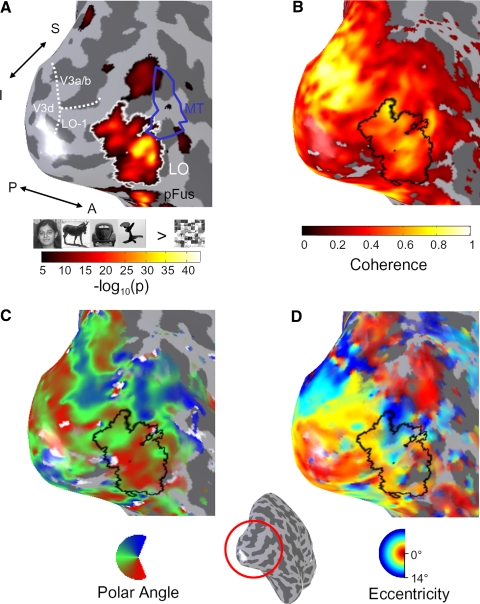
FIG. 2.
Activation maps in the lateral occipital (LO) object-selective region during localizer and retinotopy experiments. Results are shown on the inflated cortical surface representation of subject S2, zoomed in on the lateral occipital aspect of the right hemisphere. Inset: location of zoomed region (red circle) with respect to the right hemisphere. A: localization of region LO. Overlay indicates −log10(p) value of a t-test between object images (faces, cars, sculptures, and animals) and scrambled object images during a localizer scan, thresholded at P < 10−5, uncorrected. LO is outlined in white. Area MT is outlined in blue, as defined in a separate localizer. The boundary between areas V3d, V3a/b, and LO-1 is shown by the dotted white line. B: coherence map during a polar angle-mapping scan. C: polar angle map. D: eccentricity map. For B–D, overlays are thresholded at a coherence of 0.20, and LO is outlined in black. Direction labels: S, superior; I, inferior; P, posterior; A, anterior. Inset: zoomed-out view of right-hemisphere cortical reconstruction, showing the location of the zoomed region.

