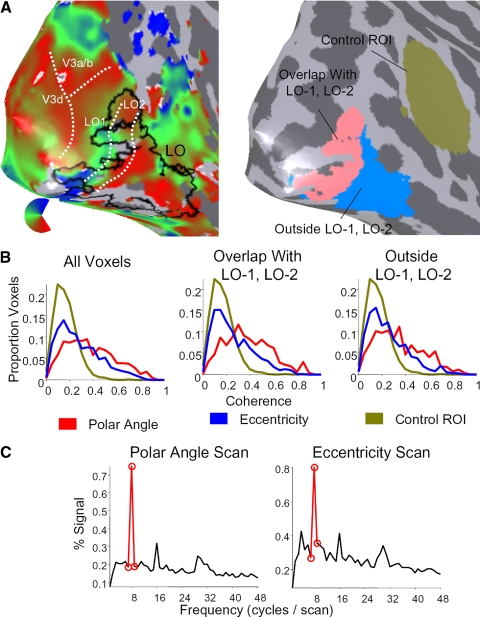
FIG. 3.
Retinotopic modulation for voxels in LO overlapping with, and outside of, visual field maps LO-1 and LO-2. A: separation of the object-selective region LO into 2 subsets. Left: polar angle map shown on right hemisphere cortical surface of subject S3 (same view as in Fig. 2) with boundaries between regions LO-1 and LO-2 marked in white, and the outline of LO marked in black. Right: 2 subsets of LO shown in the same view. The pink region of interest (ROI) is the region that overlaps with LO-1 and LO-2, whereas the blue ROI is the region lying outside these maps. The ochre ROI is a control ROI positioned along the superior temporal sulcus. B: histograms of signal coherence at the stimulus frequency during polar angle scans (red), eccentricity scans (blue), and in the control ROI (ochre; combined coherence from both polar angle and eccentricity scans). Left: data from all LO voxels; the middle panel shows data from the subset of LO which overlaps with visual field maps LO-1 or LO-2; right: data from the subset of LO lying outside LO-1 and LO-2. C: mean Fourier spectrum across all voxels for the subset of LO lying outside LO-1 and LO-2, during the polar angle (left) and eccentricity (right) scans. Power at the stimulus frequency is indicated in red.

