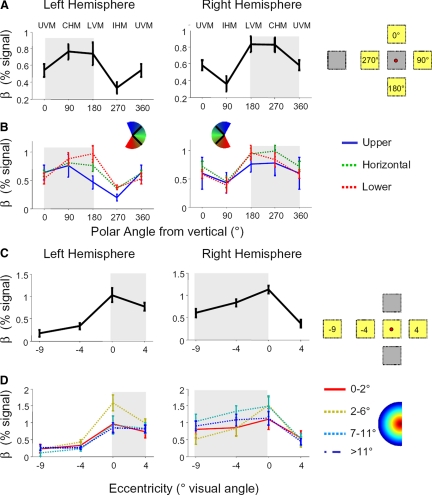
FIG. 6.
A: mean response amplitudes across LO to all objects compared with the baseline fixation condition for stimuli at 4 different polar angles with the same eccentricity (4°). B: mean response within 3 subsets of LO. Solid blue: voxels that preferred upper visual angles; dashed green: voxels that preferred horizontal visual angles; dotted red: voxels that preferred lower visual angles. For consistency with Fig. 5, the 0 = 360° condition data point is repeated. C: mean LO response to different eccentricities along the horizontal meridian relative to the fixation baseline. D: LO response to different eccentricities in 4 subsets of LO: solid red: preferred eccentricity is within 2° of the fovea; dashed yellow: 2–6° eccentricity; dotted cyan: 7–11° eccentricity; dash-dot blue: 11–14° eccentricity. Data are presented from session 3 in the object experiment; error bars represent SE across subjects. The visual field contralateral to each hemisphere is shaded.

