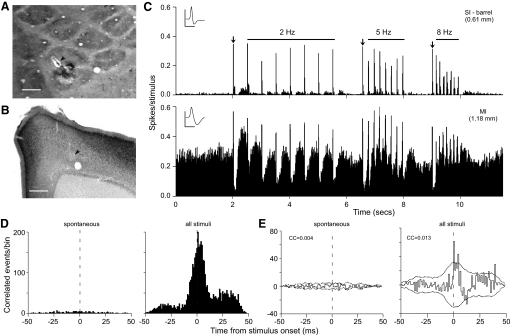
FIG. 8.
Example of weak coordination between a barrel neuron and an MI neuron. A: tangential section through layer IV of SI barrel cortex shows the recording site (arrowhead) in barrel D1. Scale: 250 μm. B: coronal section from the same animal shows the MI recording site (arrowhead). Scale: 500 μm. C: PSTHs of SI and MI responses recorded at specific depths. Bin widths: 10 ms; waveform scales: 1 mV, 1 ms. D: raw cross-correlograms (CCGs) show changes in MI activity as a function of SI barrel discharges at time 0, during the prestimulus spontaneous period and subsequent whisker stimulation periods at 2, 5, and 8 Hz. The second CCG (all stimuli) is based on responses to all 24 stimulus presentations. E: shift-corrected CCGs for the same neuron pair based on spontaneous and all stimulus-induced discharges. Dotted lines indicate 99% confidence intervals. CC, correlation coefficient; bin widths: 1 ms.

