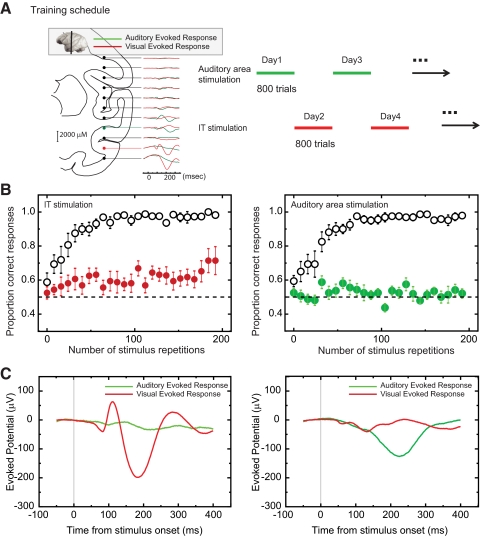
FIG. 4.
Areal specificity of learning effects. A, left: depth profile of local field potentials (LFPs). Illustration of the estimated coronal brain section superimposed on LFPs evoked by auditory (green line) and visual (red line) stimuli. Right: an alternate day training schedule was applied to microstimulation learning in a learning naïve monkey to compare learning rates for stimulation in visual and auditory responsive areas. B, left: averaged learning curve from 10 IT stimulation experiments. Performance (y axis) for distinct condition (unfilled circles) and ambiguous condition (filled red circles) is plotted against number of stimulus repetitions. Right: average learning curve from ten auditory area stimulation experiments. Performance (y axis) for distinct condition (unfilled circles) and ambiguous condition (filled green circles) is plotted against number of stimulus repetitions. Error bars denote SD. C, left: averaged LFP from 10 IT stimulation sites. Right: averaged LFP from 10 auditory area stimulation sites. Red line shows response for visual stimuli. Green line shows response for auditory stimuli. x axis represents time after onset of visual and auditory stimulus. Y axis represents amplitude of LFP.

