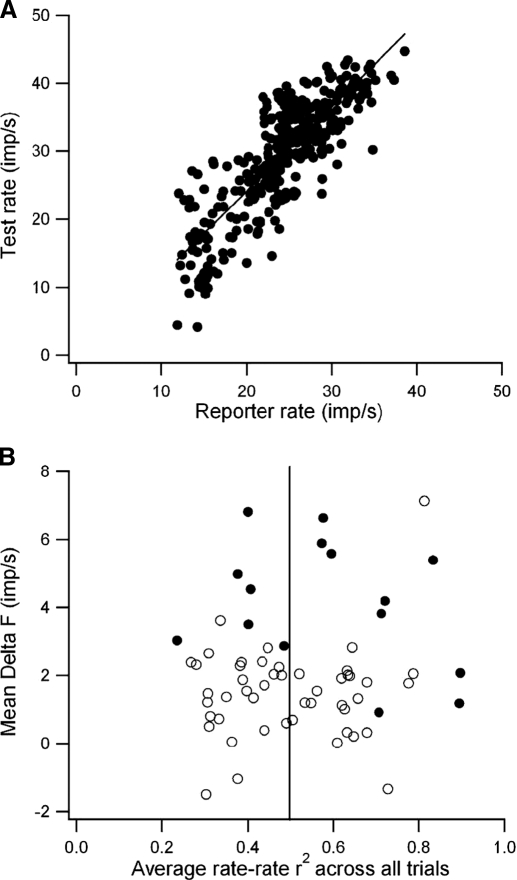
FIG. 6.
A: correlation between test rate and reporter rate (averaged over 0.2-s time bins) compiled from all 35 trials with high rate-rate correlations for the motor-axon pair of Fig. 3, A and B. B: relation between average ΔF values and average r2 value for rate-rate correlations for all units and trials. Note that ΔF values are predominantly positive even in cases when the average rate-rate correlations are low.

