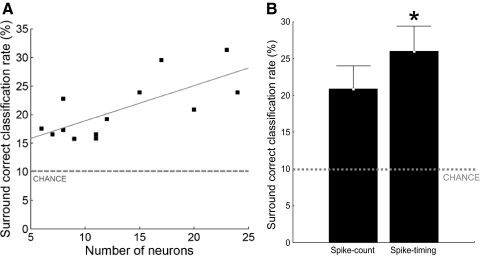
FIG. 2.
Single-trial discrimination between surround locations. A: scatter plot of the average classification performance of surround locations (expressed as correct classification rate, y axis) as a function of the number of neurons in the population (x axis). —, best linear fit of the data (Pearson r = 0.74, P = 0.0048); ···, chance classification performance (10%). Each square represents the average classification performance of 9 surround locations for 1 population of infragranular neurons recorded from within an estimated column/segregate. The classification performance was obtained with the PSTH-based classification method (Foffani and Moxon 2004) using spike count. B: spike count vs. spike timing. The average classification performance of surround locations (y axis) significantly increased (*) when spike timing was used for the discrimination as compared with spike count alone (x axis). Whiskers represent 95% confidence intervals. ···, chance classification performance (10%).

