
Figure 5. Treatment effects: Binding to three nAChR subtypes in adult and periadolescent rat brains.
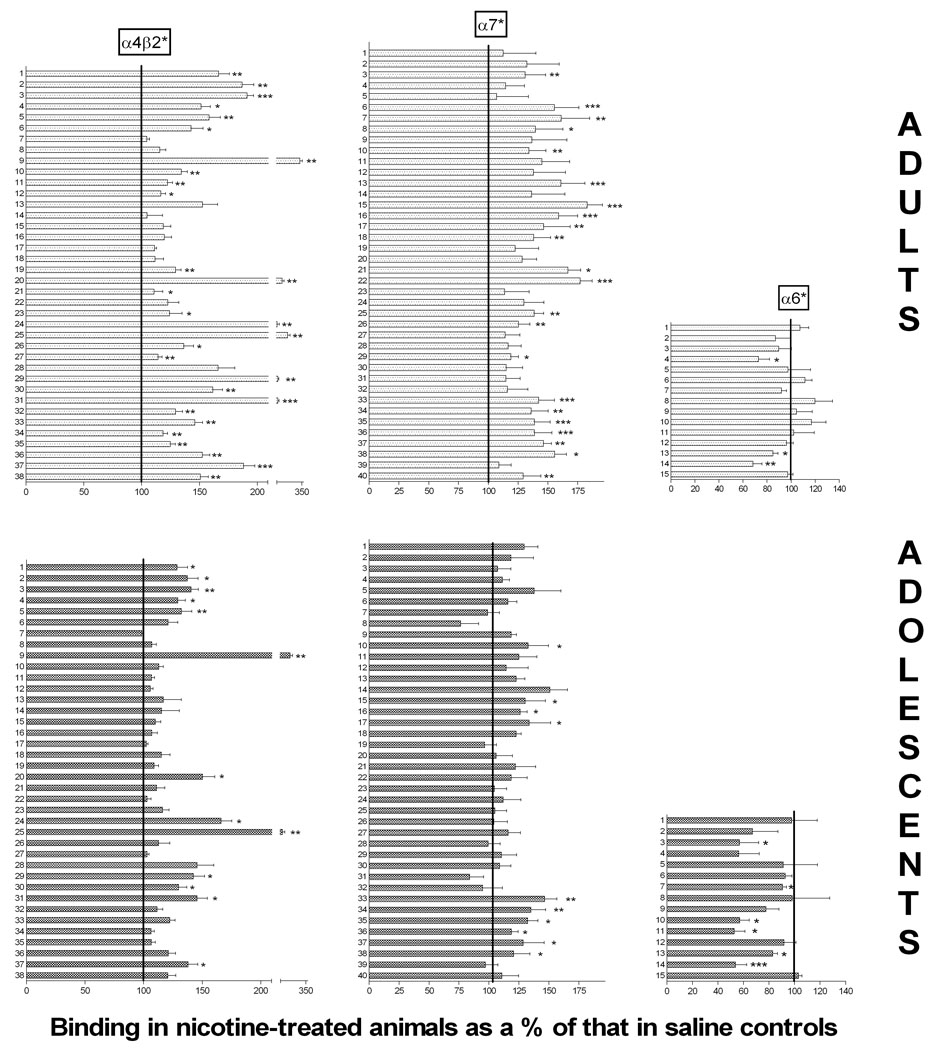
Binding in nicotine-treated animals is shown as a percent of that in the equivalent brain region in the saline-treated animals, for both adults (top three graphs) and periadolescents (bottom three graphs). The 100% line indicates where the binding would be if it was unaffected by nicotine treatment. Left two graphs show binding to α4β2* nAChRs; middle two graphs show binding to α7 nAChRs; right two graphs show binding to α3* nAChRs. Numbers on Y-axis refer to specific brain regions identified in Table 1 (for α4β2*), Table 2 (for α7) or Table 3 (for α6*). Different from binding in the equivalent brain region in saline controls: *p<0.05; **p<0.01; ***p<0.001; 2-way ANOVA with Holm-Sidak post-test.