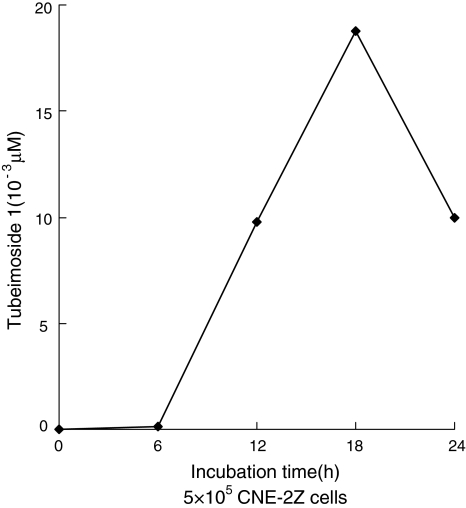
Fig. 3.
Time course of TBMS1 uptake by CNE-2Z cells. CNE-2Z cells were cultured with a final concentration of TBMS1 of 30 μM. Samples were taken at specified time intervals and prepared as described in “Materials and methods”. The methanolic extracts were used for the assays of TBMS1 concentrations by HPLC using Hypersil ODS column (5 μm 4.0 × 250 mm). HPLC analysis of time course of TBMS1 uptake by CNE-2Z cells displayed the initial markedly slow TBMS1 uptake, and then gradually reaching an apparent maximum uptake near 18 h and a decrease in cellular uptake at 24 h suggesting the cells dying and leaky

