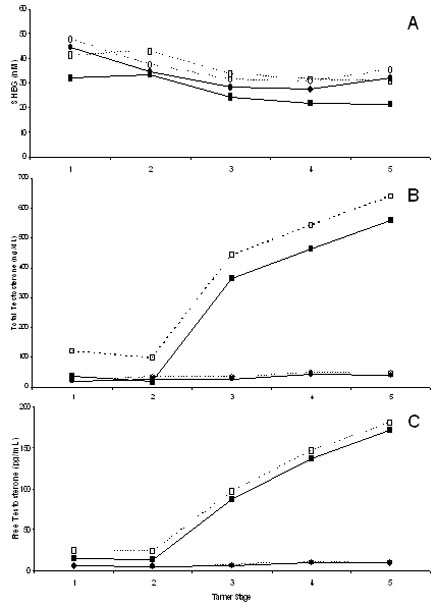
Figure 1.
Mean sex hormone levels by childhood diabetes status for males and females across Tanner stages 1-5 (n=9, 7, 13, 29, 37, respectively). Levels adjusted for body composition and race. Solid lines with black symbols=siblings without diabetes (n=47); dashed lines with white symbols=probands with diabetes (n=48; 36 type1, 8 type 2, 4 mixed phenotype); squares=males (n=51); circles=females (n=44). A: Sex hormone binding globulin, significant interaction between diabetes status and gender; B: Total testosterone, significant interaction between diabetes status and gender (to convert ng/dL to nmol/L, multiply by 0.03467); C: Free testosterone (to convert pg/mL to pmol/L, multiply by 3.467).

