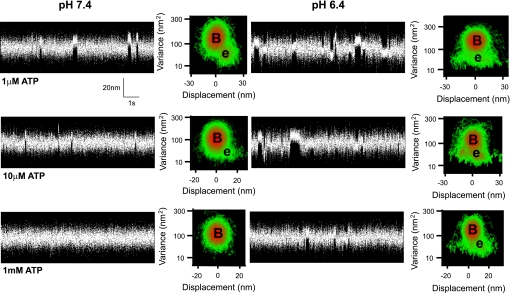
Fig. 2.
Sample single molecule data records. Short sections (∼10 s) of 1- to 3-min data records that typically contained 100–200 events are displayed. Data were obtained using a three bead laser-trap assay (12). The entire 1- to 3-min data were used to construct the adjacent three-dimensional mean-variance (MV) histogram (see methods). B, estimated peak of the baseline population; e, peak of the event population. Separate experiments were performed at pH 7.4 and pH 6.4 at each ATP concentration indicated. No significant event population was discernable at 1 mM ATP and pH 7.4, likely due the lifetime of strong attachment being more rapid than the resolution of the instrumentation (see discussion).

