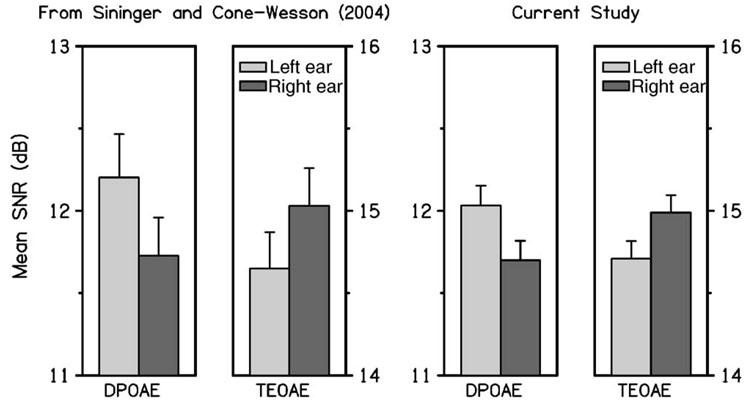
FIG. 1.
The mean and upper 95% confidence interval (CI) of the frequency-averaged DPOAE SNR and TEOAE SNR reported by Sininger and Cone-Wesson (2004) are plotted in the left-hand panels, and those obtained in the present study are plotted in the right-hand panels using similar inclusion criteria. Each error bar denotes the upper half of the CI. In each pair of bar plots, the left bar (lightly shaded) represents the left-ear response and the right bar (darkly shaded) represents data from the right ear. In the current study, there was no significant difference between ears, but there was a significant ear × type interaction, with a significant difference between ears for DPOAE SNR.

