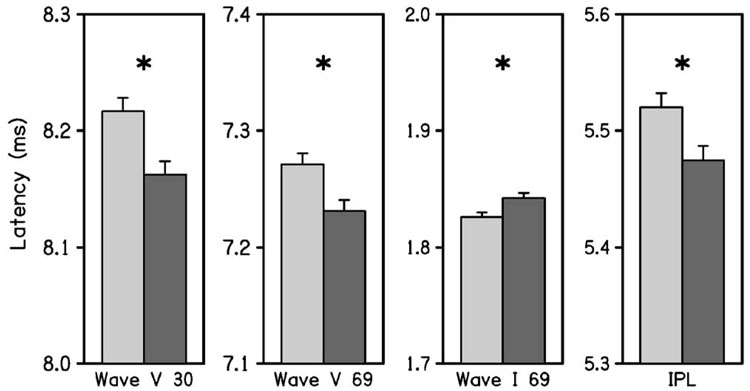
FIG. 5.
The mean and 95% CI of the ABR wave latencies are plotted in each panel. The latency responses from left to right across these panels are for wave V at 30 dB nHL, wave V at 69 dB nHL, wave I at 69 dB nHL, and the IPL (i.e., wave V latency minus wave I latency) at 69 dB nHL. In each pair of bar plots, ear is designated following the conventions used in previous figures. An asterisk denotes that ear was significant for a particular ABR latency.

