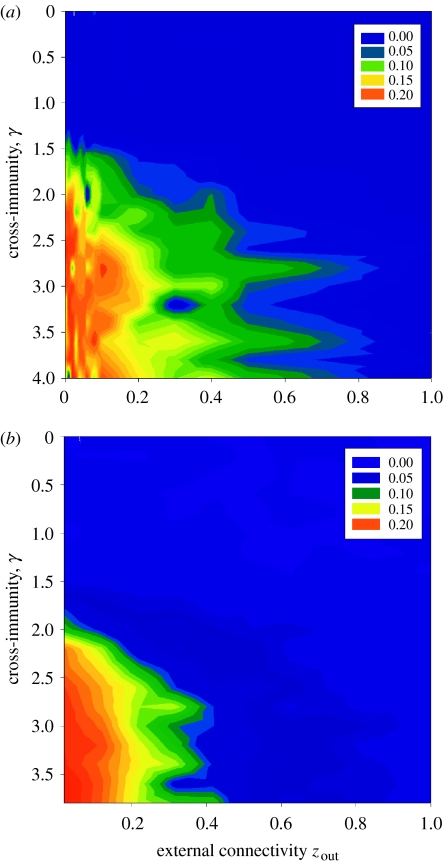
Figure 5.
Relationship between cross-immunity and connectivity in the stochastic models. For both models, the colours represent the absolute difference between the individual communities' diversity and the diversity of the population as a whole. Results of the (a) random-mixing stochastic model and (b) network model.

