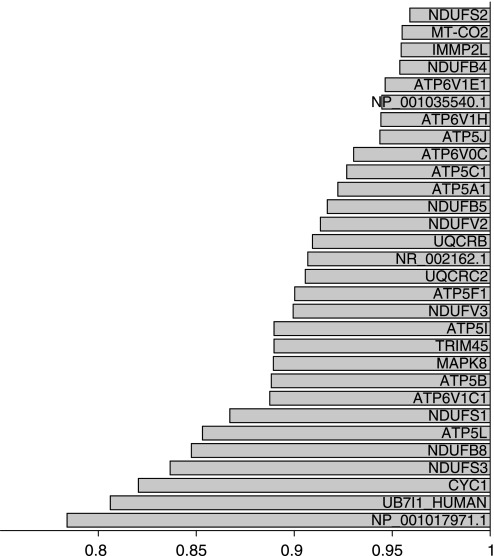
Fig. 1.
Transcription of the genes in the oxidative phosphorylation pathway (GO:0006119) was coordinately downregulated in the obese cotwins' adipose tissue compared with transcription in the nonobese cotwins' adipose tissue in 13 monozygotic (MZ) twin pairs discordant for obesity. The nonobese cotwins' gene expression values are set as 1.0. The x-axis shows the ratio of the obese to non-bese cotwins' expression values. On the y-axis are the 30 most differentially expressed genes until optimum pathway composition was reached.

