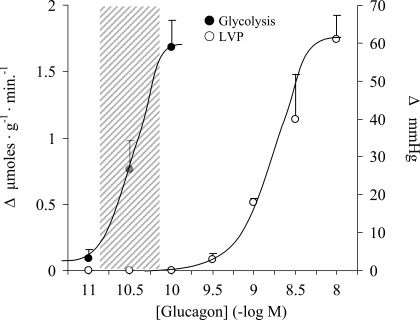
Fig. 2.
Concentration-effect curves for glucagon showing stimulation of glycolysis (left) and left ventricular pressure (LVP; right) in perfused working rat hearts. Responses represent increases over basal values. The shaded area denotes the blood glucagon concentration range in either rats or humans (1, 16, 17, 24). Each point represents the mean ± SE; n = 3–11.

