
Figure 2.
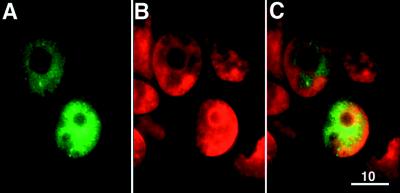
Subcellular localization of exogenously expressed BRCA2. Representative images of live 293T cells transfected with pGFPB2. (A) Image showing the green signal of GFP-BRCA2 in transfected 293T cells. (B) Image showing the nuclei of cells in the same field labeled with Hoechst. Hoechst labeling is indicated as red color instead of its authentic blue color. (C) Overlay of the images in A and B. (Bar = 10 μm.)