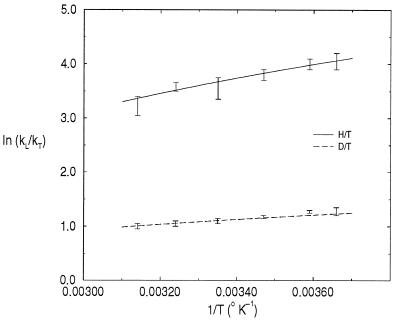
Figure 1.
Isotope effects for the BSAO reaction. The upper curve refers to the H/T effect and the bottom curve to the D/T effect. The bars indicate the experimental results of Grant and Klinman (2). The solid lines are not straight lines. They are the fittings we performed with the hyperbolas of Eq. 18.

