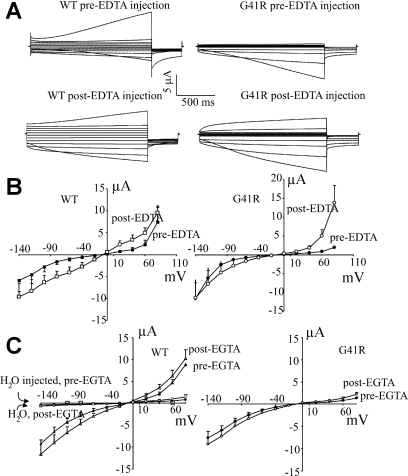
Fig. 2.
Effects of EDTA injection on the FXYD2 WT and G41R-induced currents in X. laevis oocytes. A: representative currents for each of the FXYD2 WT currents and the G41R currents, before and after injection of 25 nl of 200 mM Tris-EDTA (pH 7.3). B: steady-state current-voltage (I-V) relationships for the FXYD2 WT and the G41R currents, before and after EDTA injection. Bars show means ± SE (WT, n = 7; G41R, n = 8). *P < 0.01, G41R compared with WT. C: pseudo steady-state I-V relationships for the FXYD2 WT and the G41R currents, before and after injection of 25 nl of 200 mM Tris-EGTA (pH 7.3).

