Fig. 7.
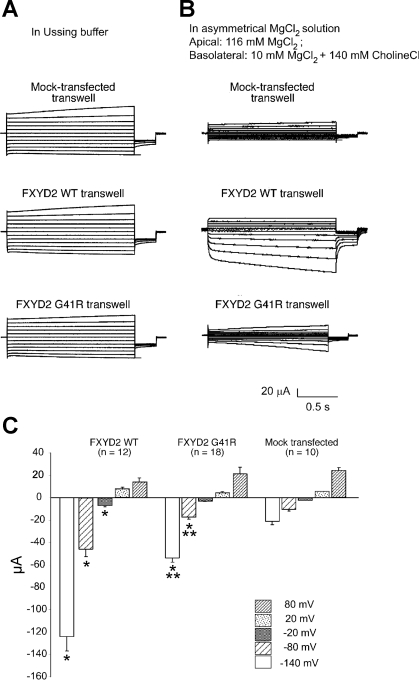
Transepithelial current measurements in control, FXYD2 WT, or G41R-expressing MDCK cells. A: apical and basolateral membranes were exposed to the identical physiological solution containing 140 mM NaCl, 5 mM KCl, 0.36 mM K2PO4, 0.44 mM KH2PO4, 1.3 mM CaCl2, and 10 mM HEPES, pH 7.4 (Ussing buffer). Representative transepithelial currents in response to voltage steps from −10 mV to voltages between −140 and +60 mV, in 20-mV increments for the mock transfected (control), WT, and G41R MDCK cells are shown. B: representative current traces from control, WT, and G41R MDCK cells with 116 mM Mg2+ at the apical membrane and 10 mM Mg2+ at the basolateral membrane. C: comparison of the transepithelial currents at different voltages from the control, WT, and G41R MDCK cells when exposed to a large transepithelial Mg2+ concentration gradient {apical [Mg2+], 116 mM; basolateral [Mg2+], 10 mM}. *Values that are significantly different from the control value and **values statistically different from WT values (P < 0.01).

