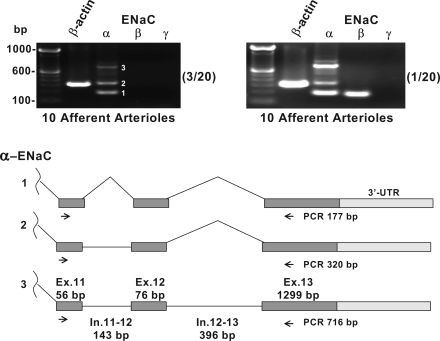
Fig. 4.
As shown in top, the ENaC α-subunit assay produced multiple PCR products in 4/20 assays (labeled 1–3 in top left). These three products were sequenced and found to correspond to the predicted processed, partially processed, and unprocessed mRNA sequences shown in bottom. These products were not seen in −RT control (data not shown). Nos. in parentheses represent the frequency of these observations in the 20 RT-PCR assays.

