
Figure 2.
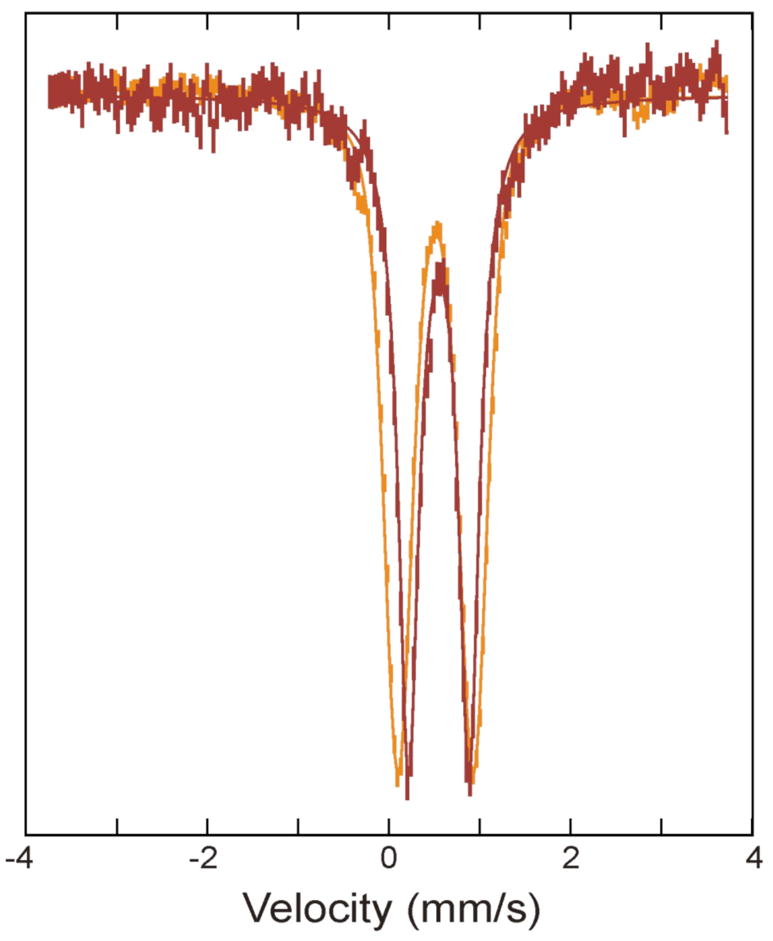
Overlay of Mössbauer spectra of the diiron(III) intermediate (red) and product (orange). The spectrum for the intermediate (red vertical bars) was prepared by removing the 56% diiron(II) contribution from the raw spectrum of the 0.14 s freeze-quenched sample (Figure 1B), and the product spectrum (orange vertical bars) was the spectrum of as-purified oxidized ToMOH. For comparison the two spectra are scaled to matching intensities. The solid lines are theoretical spectra simulated with parameters of the Fe species reported in the caption of Figure 1.