
Figure 5.
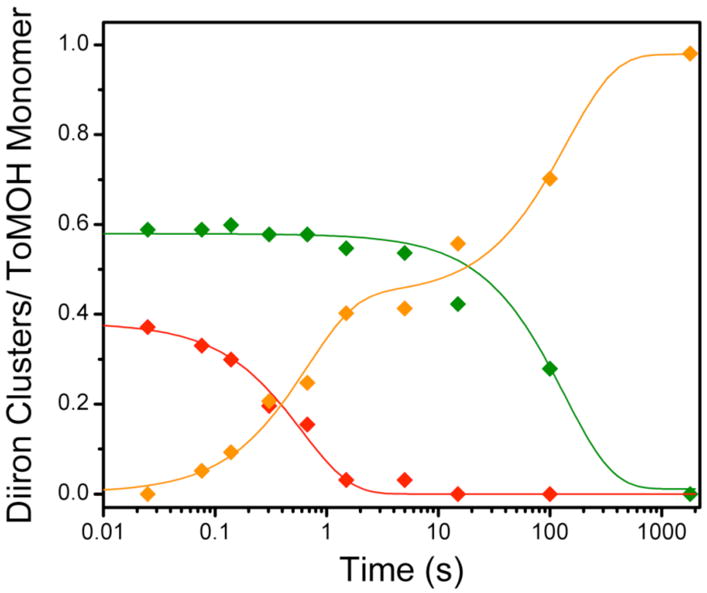
Speciation plot for reaction of the diiron(III) intermediate with phenol. The intermediate (
 ) decays at 2 s−1 to give rise to the early formation phase of diiron(III) product (
 ). Diiron(II) clusters (
 ) that do not traverse the intermediate oxidize more slowly, with a rate constant of ~0.01 s−1 to product. Solid lines represent one- or two-exponential fits to the data.