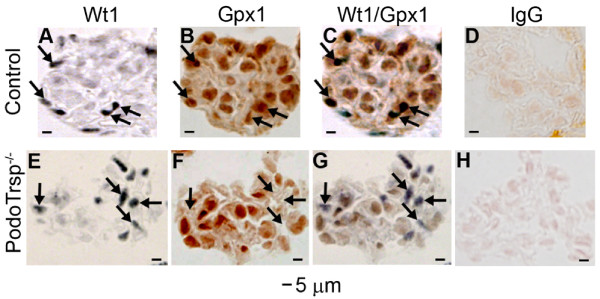
Figure 1.
Immunoperoxidase staining demonstrating a reduction in podocyte Gpx1 expression in PodoTrsp-/- mice. Consecutive 3 μm kidney sections were stained from control (TrspL/L) mice (A-D) and PodoTrsp-/- mice (E-H). A, E Anti-Wt1 antibody staining to identify podocytes (arrows). B, F Anti-Gpx1 antibody staining (arrows indicate the same cells as in A, E). C, G Merge of Wt1 and Gpx1 sections from A, B and E, F, respectively. C, Arrows indicate podocytes from control mice express both Wt1 and Gpx1. G, Arrows indicate podocytes from PodoTrsp-/- mice lose Gpx1 expression. D, H stained with normal sheep IgG as a negative control for the Gpx1 antibody.

