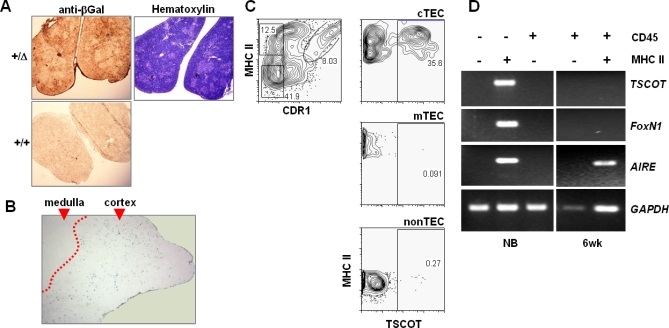
Figure 2. LacZ and TSCOT-Expressing Cells in the Thymus.
(A) Analyses of the thymus using an antibody against β-gal in newborns from a TDLacZ mouse heterozygote (Δ/+) and a wild type (+/+). Hematoxylin staining is shown on the right.
(B) β-gal activity of the thymus from 8-wk-old homozygous knock-in mouse (Δ/Δ) at 10× magnification. Cortical and medullary areas are indicated, and the boundary between LacZ stained and unstrained areas is artificially marked as a dotted line for better visualization.
(C) Flow cytometric analysis of TSCOT-expressing cells using the markers in total thymic CD45− stromal cells. The profiles of cortical marker CDR1 and medullary marker UEA-1. Defined cTEC, mTEC, and nonTEC are gated. Each gated population is shown as TSCOT and UEA-1 levels on the right. Fraction of TSCOT+ cells are shown in percentages.
(D) Message expression of TSCOT, FoxN1, AIRE, and GAPDH by sorted thymic compartments according to CD45/MHCII status using RT-PCR (30 cycles). The cells were isolated either from newborns or 6-wk-old thymuses, and the cell surface markers used for sorting are shown on top.

