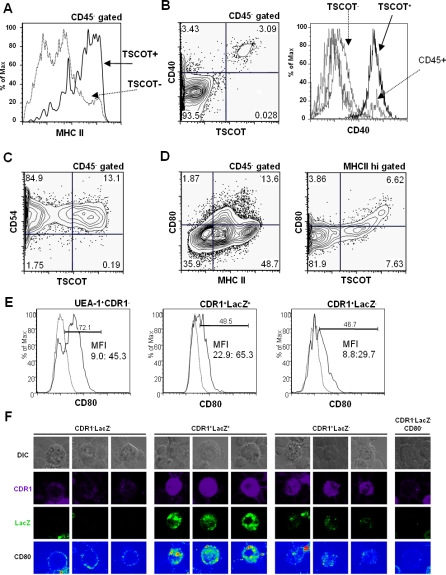
Figure 6. Costimulatory Molecules and Other Surface Marker Profiling of TSCOT-Expressing Cells.
(A) MHCII profiles of TSCOT+ cells (solid line) and TSCOT− cells (dotted line).
(B) CD40 profile of CD45− gate on the left, CD40. Histograms of TSCOT+, TSCOT−(mTEC+cTEC), and CD45+ are indicated on the right. Background histogram of live gate is shown but not indicated.
(C) CD54 profile of CD45− gate.
(D) CD80 profile of CD45− gate and MHCII hi gate.
(E) Histogram of CD80 levels in mTEC (UEA-1+CDR1−), TSCOT+cTEC(CDR1+LacZ+), TSCOT−cTEC (CDR1+LacZ−). Specific CD80 stain (solid line) and background (dotted line) of the same gates are shown. Percentage of positive cells in each gates, MFI of negative and positive gates are indicated.
(F) CD80 expression pattern of selected CDR1 and LacZ stained TDLacZ stromal cells. DIC, CDR1, LacZ, and CD80 staining patterns are shown.

