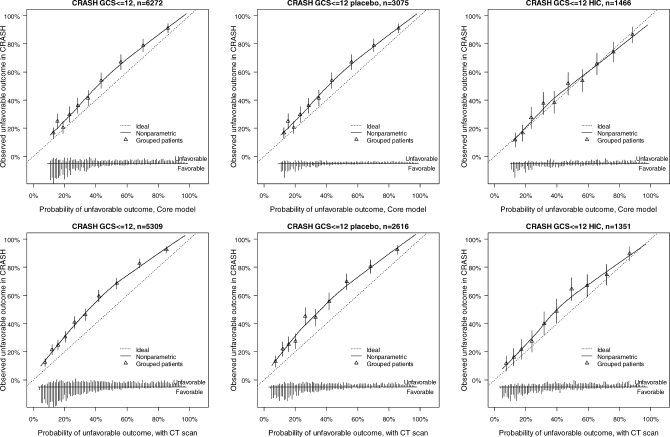
Figure 5. External Validity for the Core and Core + CT Model Characteristics for Prediction of Unfavorable Outcomes in the CRASH Trial.
The distribution of predicted probabilities is shown at the bottom of the graphs, by 6-mo outcome. The triangles indicate the observed frequencies by decile of predicted probability.

