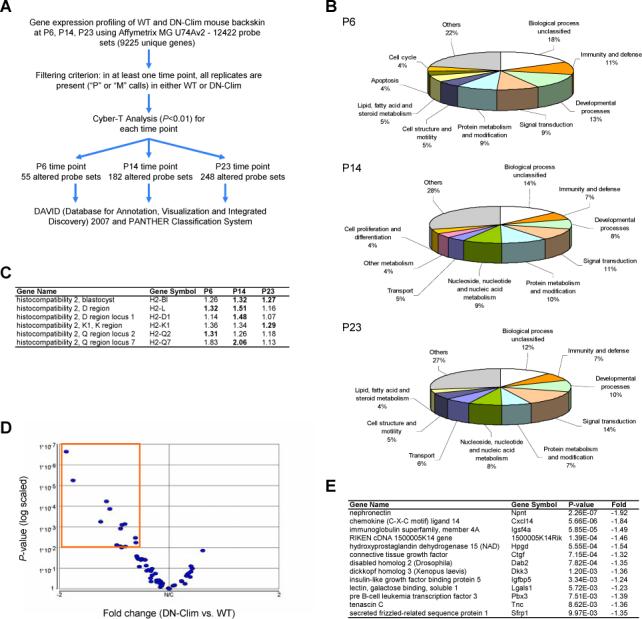
Figure 8. Abnormal gene expression profiles in K14-DN-Clim skin.

(A) Overview of microarray data processing and statistical tests to identify significantly differentially expressed genes in K14-DN-Clim transgenic mouse back skin. (B) Breakdown of biological process categories (PANTHER/X ontology) for the significantly differentially expressed genes for each of the three profiled time points: pP6, P14, and P23. (C) Members of the major histocompatibility complex genes are significantly differentially expressed at the three profiled time points. Shown are the fold changes between DN-Clim and wild-type mouse back skin and the significant differential expression is highlighted in bold. (D) Volcano plot of the significance (p-value) and degree of differential expression (fold change) between DN-Clim and wild-type P23 mouse backskin for genes known to be enriched in hair follicle stem cells. Dots within the orange outlined box represent significantly differentially expressed genes (p<0.01). These genes are listed in (E).
