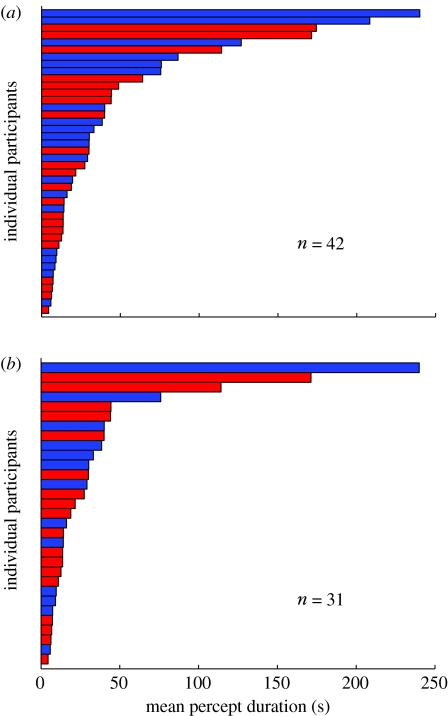
Figure 2.
The distribution of mean percept durations for (a) all participants and for (b) participants who scored greater than or equal to 75% correct for catch events. Red bars depict control participants and blue bars the participants with bipolar disorder. There was no obvious segregation between the percept durations from the two participant groups.

