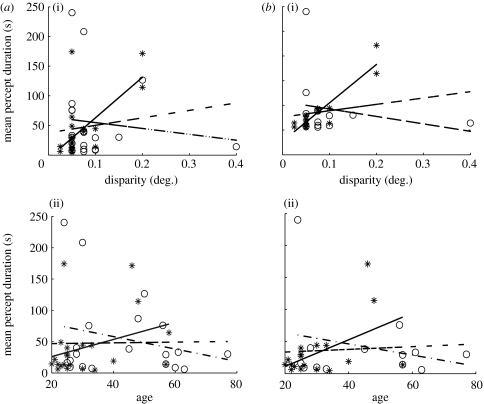
Figure 6.
Linear regression of mean percept duration and participants' stereo threshold or age. (a) For all participants, the mean percept duration in the control group (asterisks) was significantly correlated with (i) disparity threshold: controls, r=0.64, p<0.01, n=20 (bipolars, p=0.61; all, p=0.36), but not with (ii) age: controls, p=0.15 (bipolars, p=0.30; all, p=0.92). There was no correlation in the patient group (open circles). (b) As in (a) for participants with catch events correct greater than or equal to 75%. The mean percept duration for control participants (asterisks) was correlated with (i) disparity threshold: controls, r=0.92, p<0.001, n=18 (bipolars, p=0.46; all, p=0.33), and (ii) age: controls, r=0.51, p<0.05, n=18 (bipolars, p=0.41; all, p=0.73). There was no significant correlation for the patients (open circles). Asterisks, control experimental data; solid line, control prediction; open circles, bipolar experimental data; dot-dashed line, bipolar prediction; dashed line, all data prediction.

